
North Pennine (Pre 2019) LIDAR Image Downloads
Original Lidar downloads are below.
| If you are new to LIDAR you can find
background information on this web page. The local LIDAR coverage
is far from complete, nevertheless it is still a marvelous
resource. This page contains links to view the local LIDAR images
that are available as indicated on the 10sq km grid map below. The
resolution is generally at 1 metre per pixel although in a few
smaller areas 50cm or 25cm per pixel is occasionally available,
however the downloads on this page are all at 1m as it has the
most extensive coverage. The format chosen does not show woodland
or buildings. If you are interested in the technical aspects of
this data including mapping survey data then have a look at this
page. LIDAR images can be illuminated by a 'virtual sun' from any direction of the compass and at varying elevations. Two downloads have been made available with the 'virtual sun' at 210° and 300° from north (azimuth), and at 40° in elevation. Therefore the two images show shadows cast at 90° from one another. As image definition is crucial and each map covers 10km x 10km, the file sizes can be up to 43MB each depending on the LIDAR coverage within the tile. The next images illustrate what LIDAR looks like. The grid chosen is NY64 located west of Alston. |
 |
|
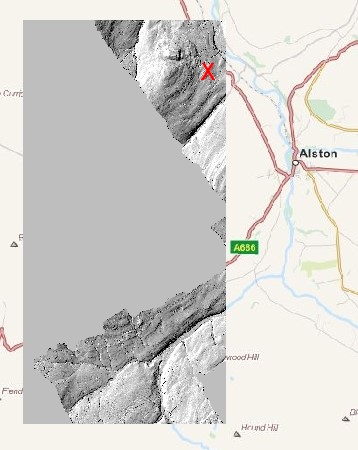
NY64 is shown left. As you can see the
available image is only approximately half of the 10km x 10km
grid, and then within that half perhaps only 40% has LIDAR data.
The red X at the top right of the image is the location of Whitley Castle (Roman Fort), which is shown in detail in the two images below. This indicates how you need to zoom into LIDAR images and then pan around them to reveal the detail. You can zoom in further still, but as these are raster images they will eventually begin to pixelate. |
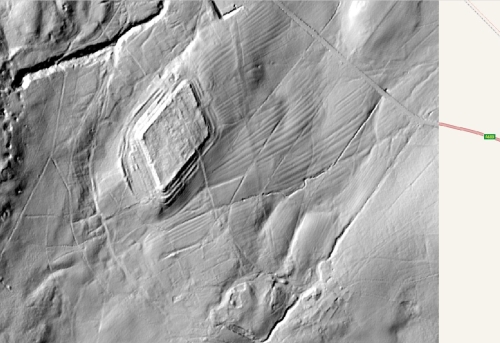 |
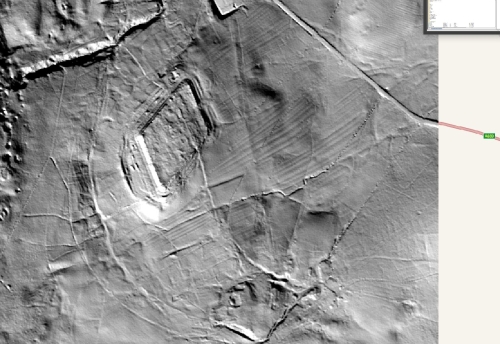
These two images have been illuminated by a 'virtual sun' from
300° (left image) and 210° (right image). You can see how the appearance of individual features varies. |
 |
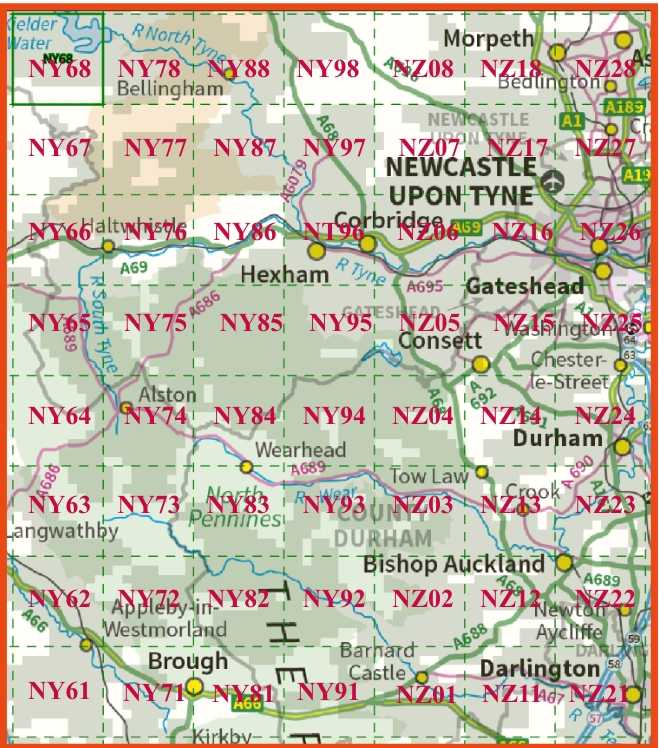 Downloads A zip file for each 10km x 10km grid can be downloaded. Each zip file contains: a) A README.txt file regarding conditions of use and an explanation of the six digit British National Grid co-ordinates used etc., b) The two LIDAR images at 210° and 300° . c) A grid image file that shows the LIDAR against the British National Grid. d) An OpenStreetView Map image of that grid to aid orientation. e) Some zip files contain the coverage map right. It can also be downloaded by clicking it. View the images in your image viewer; where you should be able to zoom and pan around each image. In many image viewers the zoom control is the + and - keys (or mouse wheel control) and panning is achieved by holding a left click on the image and dragging, or by use of the keyboard arrow keys. The labeled 10km grid map (right) indicates the available 56 grids. |
| The red links below will save all files
for the selected grid to your 'downloads' folder as a zip file.
Note: The zip files range from NY81 only 2.6MB to NZ26 at 92.6MB |
|
If you use this data in any form of publication or lecture then please acknowledge: altogetherarchaeology.org Image processing: Each OS grid is 10km square or 10,000m x 10,000m. The tiff image produced using QGIS is 10,000 x 10,000 pixels hence the 1m resolution where 1 pixel represents 1 square metre. The tiff image is converted to a jpg file type using zero compression to maximise sensitivity. The jpg image size is the same as the tiff at 10,000 x 10,000 pixels. The jpg images has had a gamma correction factor of 0.6 applied to improve contrast.
Data courtesy of the Environment Agency.
LIDAR images are released as part of the
UK Government's open data scheme.
Maps: ©OpenStreetMap contributors. LIDAR data processed by Stephen Eastmead (webmaster@altogetherarchaeology.org). |