| To begin look
at some report maps that have been generated using GIS software.
Click on:
2018 Project Design and 2017 Interim Report
to download this interim report. This will be saved in your download
folder and depending on your settings it may open up
automatically. If not open the pdf manually. Have a look at the following
figures all of which have been created in GIS software. Figures:
2, 3, 5, and 11. |
| Figure 3 is a GPS
survey of features, watercourses and field boundaries with
added OS height contours and British National Grid (BNG) lines. |
| Figure 5 is a GPS
trench outline on BNG coordinates and a photogrammetry plan view
of the trench orientated as an overlay layer. |
| Figure 11 shows the
2017 trenches and the proposed 2018 trenches. |
| As you can see the
GIS generated maps are of suitable quality to include in
fieldwork reports. |
| |
| Requirements: |
1. GIS software.
There are lots of GIS systems to choose from. However the
professional systems are expensive. The system used by AA is
called QGIS. The Q did stand for Quantum but they have since
dropped that and just call it QGIS. QGIS is free and can be
downloaded from
https://qgis.org/en/site/forusers/download.html.
All QGIS systems are seriously large and potentially daunting
pieces of software. However, for basic archaeology related mapping you
only use a fraction of QGIS's functionality, so if you follow my
suggested path indicated below, then as long as you have a reasonable level of IT
skills you should get some results fairly quickly. |
| 2. Maps. There are
two types of map which you need to be familiar with, they are
raster and vector maps. The best free map downloads for the UK are those
supplied by the
Ordnance Survey Open Data website. You will
see both raster and vector map downloads there. The suggested path
indicated below explains the difference. QGIS also has the ability
to use the free available online map and any other suitable
digital mapping that you have licenses to use. |
| 3. GPS Data. GPS data is handled in QGIS very much like vector map data, so
once you understand how to use vector maps then you also know how
to process GPS data files in QGIS. However, you need to be
familiar with using GPS instruments and processing the measured
coordinates to produce the GPS compatible output data files. This
is covered in the How to: GPS page (link above). |
| 4. Lidar. Lidar is an acronym for
Light Detecting
And Ranging. It is very similar
to RADAR and SONAR but using frequencies in the light segment of
the electro-magnetic spectrum rather than radio or sound waves.
Although lidar is an acronym, it is accepted that you can treat it as
a noun like: Lidar/lidar and not as LiDAR. The basic premise is
that infra-red laser light emitted from an aerial platform like an
aircraft or drone directly at the ground, is reflected by the
surface features on the ground. The reflections are detected and
processed to reveal height difference of those features. The
detected heights are recorded against the GPS coordinates of the
ground (georeferencing). Various data definitions can be obtained,
the common ones are: 25cm2, 50cm2, 100cm2,
and 200cm2 per pixel. In the UK and many other
countries around the world, lidar data can be freely downloaded.
In the UK there are separate websites for England, Scotland, Wales
and Northern Ireland. In England the data is far from complete. It
is hoped to get he full UK coverage by about 2020/2021. The lidar
data downloads are text files containing millions of numbers and a
few lines of coordinate information. These files have to be
processed before an image is revealed. This is covered in the
suggestive path below. |
5. The
suggested path. If you want to start to learn how to use
QGIS on your PC or Laptop then this is possible. You will need to
download and install a few free programs and data files to get started.
The recommended method is to process lidar data in QGIS and
then look at setting the lidar images against various map backgrounds. A
downloadable GPS data file can be displayed either on top of the map
or the lidar image. Then the data can be used to generate the type
of maps you viewed in the introduction above. All the necessary
instructions are available on a pdf document you can obtain by
using the
QGIS-LIDAR link on the main menu bar.
The pdf does include other methods of processing lidar data, one
in particular is good but it has to be bought. Likewise one of the
GPS software suggestions is not free but there are other free
alternatives. In addition, the guide describes how you can get
started generating 3D lidar models too. If you can afford it, we ask for a donation to
Altogether Archaeology fieldwork fund in return for all the work
required to produce the guide.. |
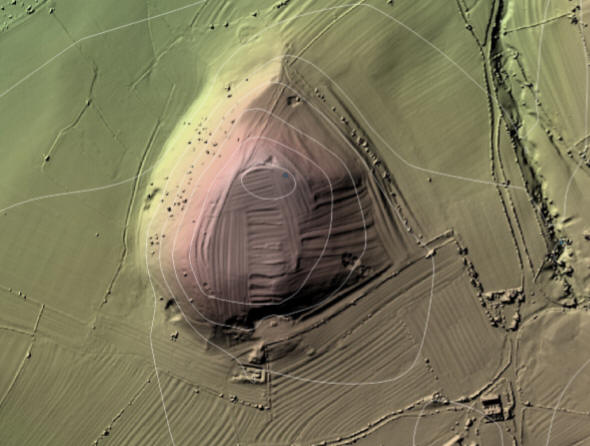
Below: Three of the QGIS lidar images that can be generated when
following the instructions in the pdf guide, which also includes
an introduction to 3D models.


|
