| GPS instruments come
in two broad categories. Consumer grade like the Garmin hand held
devices and high end smart phones that have a broad accuracy of 3
to 5 metres, and professional grade instruments that can be accurate to a
centimeter or two. They are totally different beasts but both are
useful instruments as long as you realise their respective
limitations. It is very likely that in the next few years you will
see high end smart phones and consumer grade GPS's improve their
accuracy to sub metre levels. |
It is helpful to
look at accuracy especially when using a consumer grade GPS or a
smart phone GPS. If you carefully measure a rectangular house
foundation walls on two successive days and map the results you
are very likely to get a map like this: As you can see, the shape of foundation is consistent but the
position within the maps grid lines has varied. That is the
relative accuracy of a succession of GPS measurements is good but
map accuracy is relatively poor. Secondly, to obtain the best
possible data from consumer grade instruments I have found that it
is important to standardise how you make the readings.
As you can see, the shape of foundation is consistent but the
position within the maps grid lines has varied. That is the
relative accuracy of a succession of GPS measurements is good but
map accuracy is relatively poor. Secondly, to obtain the best
possible data from consumer grade instruments I have found that it
is important to standardise how you make the readings. |
Handheld GPS
device e.g. Garmin GPSMap 60CSx Methodology
a. Batteries: always use fresh fully charged
batteries. Replace them when they are half used. Use high capacity
rechargeable batteries like AA batteries 3000mAh. In my experience
at some point as the battery becomes exhausted waypoint accuracy
can be significantly affected.
b. Turn your GPS on 5 to 10 minutes before
starting to survey.
c. Always start a new survey day by deleting all
previous data from your GPS.
d. Having set the GPS to use feet rather than
metres, the Accuracy value displayed on the Map page is in feet
rather than metres. This gives you a better indication on how well
the GPS is performing whilst you are taking measurements, as the
number range displayed has more increments (e.g. 3-6 metres has 4
increments, whereas in feet the equivalent is 10 to 20 or 11
increments).
e. Display the GPS map page zoomed in to the
maximum setting (e.g. 20 feet on the Garmin GPSmap 60CSx). At
maximum zoom the small arrow in the middle of the screen is at its
most sensitive; so you can observe small movements in the arrow
which should stabilise before a waypoint measurement is made.
f. When making waypoint measurements always have
the Map page displayed and constantly monitor the Accuracy value.
Typically in good conditions it will be between 10 and 20 feet
(usually less than 16 feet). Above 20 feet consider using an
external aerial - the Garmin GPSMap 60CSx has an external aerial
input socket.
g. Make at least 10+ waypoints around the
boundary of small features (less than 5m diameter). More
measurements are always better than less. When features have been
identified using small flags, always consider what it will be like
drawing the feature. Take as many measurements in-between flags as
necessary and particularly so around curved features.
h. Always hold the GPS upright at chest height
whilst taking measurements. Always walk between measurement points
holding the GPS in this position. If you have to put the GPS down
or in a pocket, always hold it upright and at chest height for 20
seconds (or more) before making a waypoint measurement, and only
then when the central arrow has stabilised.
i. Before taking each waypoint measurement, watch
the map indicator arrow on the GPS unit (at maximum zoom in) until
it has settled down, usually about 5-10 seconds if you have kept
the GPS upright at chest height between measurements.
j. The most likely cause of inaccurate
measurements is rushing. Take your time and make sure the GPS has
stabilised before taking each reading. It is quicker to give the
GPS an extra few seconds to stabilise in-between readings than to
have to repeat the measurements on another day.
k. There is one exception to the previous point.
If you are taking waypoint measurements along a straight linear feature
like a straight bank or fence-line, then I have found that if the
first and last waypoints are measured normally, if you walk a
straight path along the feature, then you can take a reading every
few paces without stopping.
l. When measuring significant banks or lynchets,
then take measurements on the top of the bank or lynchet where the
break of slope occurs, and again at the foot of the bank or
lynchet where the ground levels out. When mapping these features
you then know how long to make the hachures when drawing your map.
m. Keep a written Log of the waypoints and
description of what you are measuring.
n. Draw a plan view in the log so this can be
compared with the waypoint data plot. Record relevant details like
the contours of the feature.
o. Take photographs and cross-reference the
photograph’s reference number against the appropriate waypoint
number
These rules do not apply to professional grade GPS instruments
although j take your time is still good advice. |
Professional
GPS instruments
Whilst these instruments currently have significant more
accuracy when you look at the raw (uncorrected) coordinate data,
the accuracy described in the introduction is only achieved after correction of that data. To get an idea
on how they improve map accuracy take a look at the map below. If you
click the map, the webpage will open in a new window so that you
can then tab between the two windows as you continue reading.
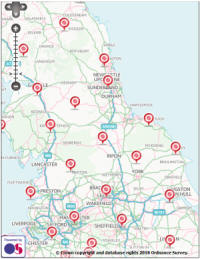 The
webpage that opens is the Ordnance Survey OS Net Rinex Data. If
you scroll down a little and look at the map you will see that you
can zoom into the North Pennine area which you will see the
locations of OS Net GPS reference receivers fairly evenly spaced
throughout the UK. Our local receivers are at Carlisle, Wearhead,
Shap and Catterick Garrison. If you click on the accuracy
statement at the top of the screen you see this statement:
The standard errors of OS Net base station coordinates are
generally better than 0.008 m in plan and 0.020 m in height. The
webpage that opens is the Ordnance Survey OS Net Rinex Data. If
you scroll down a little and look at the map you will see that you
can zoom into the North Pennine area which you will see the
locations of OS Net GPS reference receivers fairly evenly spaced
throughout the UK. Our local receivers are at Carlisle, Wearhead,
Shap and Catterick Garrison. If you click on the accuracy
statement at the top of the screen you see this statement:
The standard errors of OS Net base station coordinates are
generally better than 0.008 m in plan and 0.020 m in height.
The GPS satellites that provide the data will be a mix of
American, Russian and eventually European satellites. To remain
useful the agencies that control their respective satellites have
to continually adjust their orbits and keep them calibrated, but
inaccuracies still occur. The OS Net reference stations are high
grade GPS units permanently fixed on suitable buildings that have
an open aspect to see all the satellites. They all are obviously
of known latitude, longitude and height above mean sea level. Each
station then compares its 'GPS' location with its known location
and calculates a correct factor for that reading. This is done
every second. Most commercial users buy a license to be able to receive the
'real-time' data corrections via the cell phone network. Alternatively, the data corrections can be made
retrospectively by downloading the data via the Internet. The
cost of the 'real-time' data correction license is usually too high for community voluntary
groups, but there is a free version. If you view the OS Net page
again you can complete the form beside the map and download the
correction data from the closest reference stations for the
survey's time period (GMT). This data however is not one second
corrections but one minute corrections.
In AA's recent excavations at Well Head, Holwick, we have borrowed
a professional grade GPS from
SWAAG and used the one minute correction data to
create the trench maps in QGIS.
|
Necessary
'Jargon'
Unfortunately when you get into GPS, Maps and GIS systems
you need a basic understanding of a number of facts that appear as
abbreviations, coupled with an awareness of their limitations.
Starting with British National Grid (BNG)
and latitude and longitude as used by Google Earth which uses the
World Geodetic System 1984 (WGS84) as a
geodetic datum featuring coordinates that change with time
(continental drift). WGS84 is defined and
maintained by the United States National Geospatial-Intelligence
Agency (NGA). It is consistent, to about 1cm, with the
International Terrestrial Reference Frame which allows for the
Earth's crust moving due to plate tectonics, regional subsistence
and various celestial effects. With WGS84 the height datum is
based on the height above the centre of the Earth, where as the
BNG is based the ODN (Ordnance Datum Newlyn), defined as the Mean
Sea Level at Newlyn in Cornwall between 1915 and 1921.
Note:
The British National Grid is also referred to as: BNG =
OSGB 36 = EPSG:27700 [You will see this
when working with GIS software].
The World Geodetic System 1984 is also called: WGS 84 =
EPSG: 4326 [This is the standard coordinate navigational
system for the Earth. It is periodically modified to account for
continental drift etc.]
The European Terrestrial Reference System 1989 (ETRS89)
is a Cartesian reference frame, in which the Eurasian Plate as a
whole is static. The coordinates and maps in Europe based on
ETRS89 are therefore not subject to change due to the continental
drift. |
Most will have seen
both maps displaying latitude and longitude and when it comes to
the UK the Ordnance Survey (OS) British National Grid (BNG)
coordinate system in the form of two letters followed by up to 10
digits. Lets look at the centre of the ford over the River Wear at
Stanhope. On the OS 1:25000 map and on Google Earth.
The OS map gives the position and altitude as NY 99100 39188 at
199m, whilst Google Earth gives: 54° 44' 51.40"
N 2° 00' 55.80" W at 203m.
This OS webpage enables you to transform BNG
to latitude and longitude. When you do that you get: 54° 44'
51.65" N 2° 00' 55.84" W at 249m.
Not perfect especially the height. So what is happening? Lets
look at two images from
this Wikipedia page below: |
|
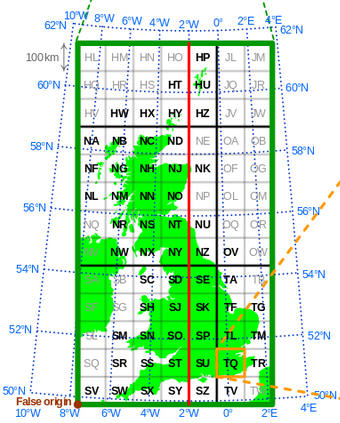
The first diagram (below left) demonstrates that the regular
square BNG when superimposed over latitude and longitude
gridlines. There is a non-linear relationship between the two as
you go from south to north. It is obvious that when converting a
BNG coordinates to latitude and longitude or vice versa, then the
algorithm must take this into account. So there cannot be a single
accurate conversion factor. |
|
|
|
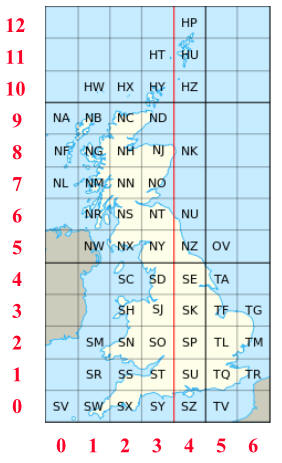
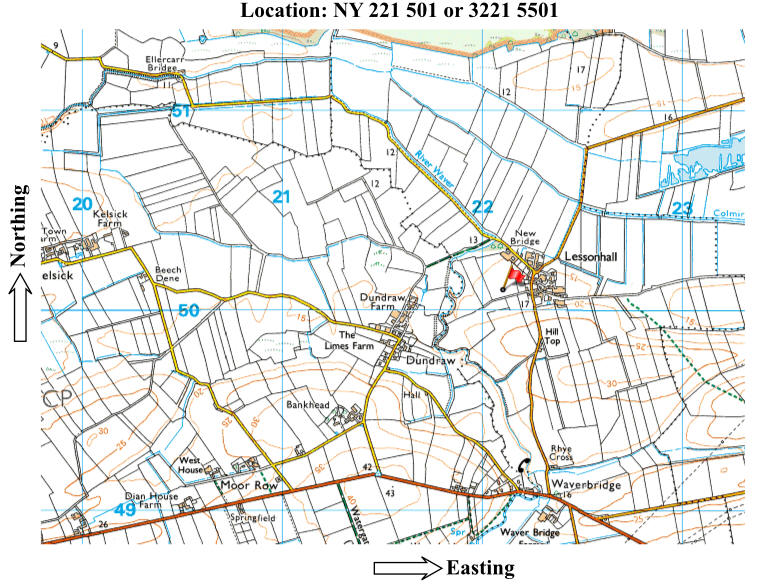
As soon as you move from paper maps to digital map software, like
GIS systems, then the BNG grid letters are not used but replaced
with numeric equivalents. For example the grid NY has a 3 before
the easting and a 5 before the northing. So NY 221 501 becomes
3221 5051. The second and third diagrams (above centre & right)
shows how the digital equivalent to the grid letters is derived.
See map below: |
 |
| With the above
information lets look at the conversion of coordinates to and from
BNG and WGS84. This happens often and frequently in the
background. GPS instruments record locations in WGS84 being the
worldwide standard system, but here in the UK we set GPS
instruments to display BNG. Consumer grade GPS instruments
generally offer OSGB 36 conversion which is a single Helmert
transformation. This transformation should not be used for
data that requires better than 5m accuracy. |
As we know published archaeology reports generally report features
with centimetre levels of accuracy. To do that they use
professional grade instruments and software that uses other
conversion systems. Methods for improving accuracy include a
series of 'local transformations' depending on the northing rather
than the single Helmert transformation, or a more complex
transformation that model the distortion that is required.
OSTN02 is a common example that is used. OSNT02 dates
back to 2001/2 and has been used on all Altogether Archaeology's
GPS data measured by SWAAG's Promark 120 GPS. In 2015 OSTN02 was
updated and issued as OSTN15. The difference in
accuracy between OSTN02 and OSTN15 is small, in the order of less
than -10mm to +21mm depending on the location.
For community groups using a single rover GPS and using the 1
minute correction data, then the use of OSTN15 is rather academic
as their data is already significantly less accurate than that.
For most landscape surveys and tying trenches positions into site
maps, you do not really need to have 1cm accuracy levels generated
by real time kinetic (RTK) GPS measurements.
The Promark 120 GPS generally produces GPS measurements with
indicated accuracy measurements od 20-30cm which usually reduces
after correction with 1minute correction data to 10-20cm. |
The one minute
correction data is usually downloadable approximately 2-3 hours
after the last survey measurement. How you process the GPS data
will depend on the software that you bought with your GPS. Whilst
surveying keep a log of what has been measured and where
appropriate take photographs.
Processing will generally involve connecting successive individual
coordinates with straight lines to produce an outline of the
feature. This can be done within the GPS processing software or at
a later stage using other consumer type software for processing
GPS data like
GPS Utility which is available at modest
cost. GPSU is good at converting GPS data from one file type to
another too. To import the GPS data into QGIS then several file
types can be used. I tend to use .gpx. |
| |